KAVA-Time – How man and machine analyze data

Knowledge-Assisted Visual Analytics Methods for Time-Oriented Data. New methods will take advantage of explicit expert knowledge in the Visual Analytics process of data.

KAVA-Time: Knowledge-Assisted Visual Analytics Methods for Time-Oriented Data

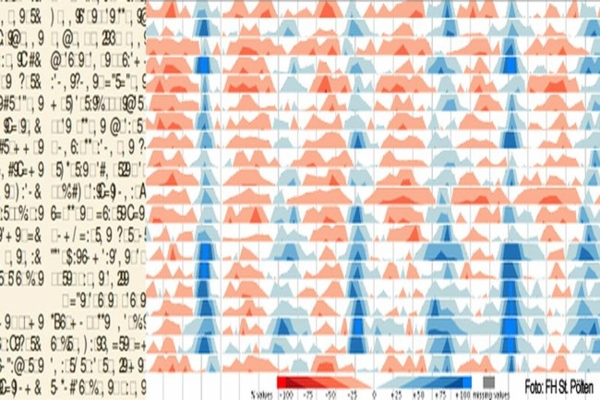
The visualization of complex data

Analytical reasoning for real world problem solving involves large volumes of uncertain, complex, and often conflicting data that analysts need to make sense of. In this context, time-oriented data is commonplace and plays a special role. Due to the distinct characteristics of time, appropriate methods for exploration and analysis are needed.

For example when displaying lab results in electronic patient records this could mean to show expected value ranges for healthy patients depending on their context such as gender or age. For representing stock price data, the time axis would suppress weekends and bank holidays to avoid a distorted representation of value change. Solutions like these might be achieved by creating specialized applications for each domain and analysis problem at hand. However, this would cause lots of effort and make maintenance and reuse difficult.

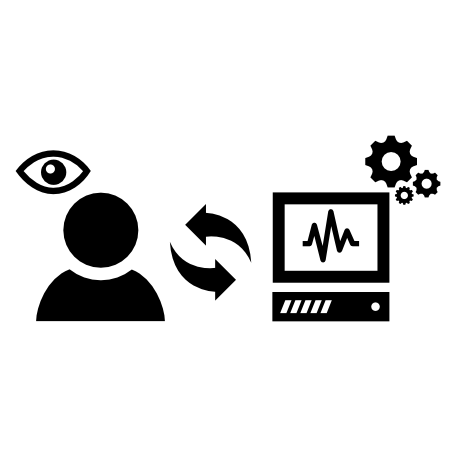
To avoid this, Visual Analytics methods which adapt to different contexts and combine interactive visual interfaces with automated analysis methods will be designed. Even though computers have the ability to recognize and visualize patterns in data, they often lack the background knowledge to interpret said data. Therefore, human analysts and their expert knowledge are essential to the process of data analysis.


How to take advantage of human expert’s knowledge

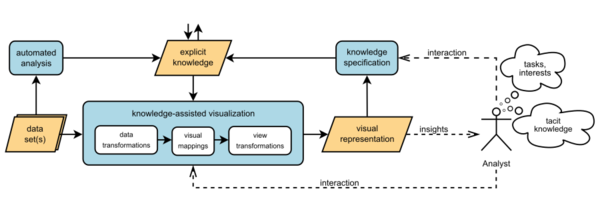
Ideally, a Visual Analytics environment would adapt itself to the user’s context and domain specifics of the data to analyse by having access to human knowledge. The basic research project KAVA-Time explores how to take advantage of explicit expert knowledge in the Visual Analytics process to make analytical reasoning more effective and efficient. The project team develops and evaluates knowledge specification methods as well as knowledge-assisted visualization and interaction methods for time-oriented data. This encompasses two main objectives:

  1. to capture analysts' domain knowledge and explorative interests
  2. to take advantage of the explicit knowledge in interaction and visualization methods.The newly integrated specification methods will not only take into account externally given knowledge but also the reuse and sharing of these specifications. Interactive Visual Analytics methods will allow intuitive and direct refinement of explicit knowledge by analysts.

Insights gained by man and machine

Tackling this issue will give rise to more effective environments for gaining insights – the possibility to specify, model, and make use of auxiliary information about data and domain specifics in addition to the raw data, will help to better select, tailor, and adjust appropriate methods for visual representation, interaction, and automated analysis.

Publications

Aigner, W. (2021, March 23). Visual Analytics for Time-Oriented Data [Invited Talk]. ERFA Industrial Data & Analytics - Zeitreihenanalyse, Kremsmünster, Austria.
Dahnert, M., Rind, A., Aigner, W., & Kehrer, J. (2019). Looking beyond the horizon: Evaluation of four compact visualization techniques for time series in a spatial context. ArXiv:1906.07377 [Cs]. http://arxiv.org/abs/1906.07377
Rind, A., Wagner, M., & Aigner, W. (2019). Towards a Structural Framework for Explicit Domain Knowledge in Visual Analytics. Proc. IEEE Workshop on Visual Analytics in Healthcare (VAHC), 33–40. https://doi.org/10/gh377m
Aigner, W. (2018, June 19). Media-Assisted Healthcare \& Living: Daten besser nutzbar machen mit Interaktiven Technologien [Keynote]. ADV e-Health Conference, Vienna.
Aigner, W. (2018, May 6). Visual Analytics as a Design Science Discipline [Inivited talk]. ICG Lab Talk, Johannes-Kepler University Linz (Austria).
Aigner, W. (2018, May 17). Visual Analytics as a Design Science Discipline [Inivited talk]. giCentre, City University London (UK).
Aigner, W. (2018, April 26). Visual Analytics as a Design Science Discipline [Invited talk].
Wagner, M., Slijepcevic, D., Horsak, B., Rind, A., Zeppelzauer, M., & Aigner, W. (2018). KAVAGait: Knowledge-Assisted Visual Analytics for Clinical Gait Analysis. IEEE Transactions on Visualization and Computer Graphics (TVCG), 25(3), 1528–1542. https://doi.org/10/ghppzn
Rind, A., Iber, M., & Aigner, W. (2018). Bridging the Gap Between Sonification and Visualization. Proc. AVI Workshop on Multimodal Interaction for Data Visualization (MultimodalVis). https://doi.org/10.5281/zenodo.6510341
Aigner, W., Rind, A., & Wagner, M. (2018). KAVA-Time: Knowledge-Assisted Visual Analytics Methods for Time-Oriented Data. Tagungsband Des 12. Forschungsforum Der Österreichischen Fachhochschulen (FFH) 2018. http://ffhoarep.fh-ooe.at/handle/123456789/1070
Luh, R., Schramm, G., Wagner, M., Janicke, H., & Schrittwieser, S. (2018). SEQUIN: a grammar inference framework for analyzing malicious system behavior. Journal of Computer Virology and Hacking Techniques, 01–21. https://doi.org/10/cwdf
Bernard, J., Zeppelzauer, M., Sedlmair, M., & Aigner, W. (2018). VIAL – A Unified Process for Visual-Interactive Labeling. The Visual Computer, 34(1189), 16. https://doi.org/10/gd5hr3
Andrienko, N., Lammarsch, T., Andrienko, G., Fuchs, G., Keim, D. A., Miksch, S., & Rind, A. (2018). Viewing Visual Analytics as Model Building. Computer Graphics Forum, 37(6), 275–299. https://doi.org/10/gdv9s7
Aigner, W. (2017, June 11). Media-Assisted Healthcare & Living: Daten besser nutzbar machen mit Interaktiven Technologien [Keynote]. IMC HealthWeek, Krems (Austria).
Thür, N., Wagner, M., Schick, J., Niederer, C., Eckel, J., Luh, R., & Aigner, W. (2017). A Bigram Supported Generic Knowledge-Assisted Malware Analysis System: BiG2-KAMAS. Proceedings of the 10th Forum Media Technology 2017, 107–115. http://mc.fhstp.ac.at/sites/default/files/publications/Thuer_B2KAMAS_2017.pdf
Schick, J., Wagner, M., Thür, N., Niederer, C., Rottermanner, G., Tavolato, P., & Aigner, W. (2017). Rule Creation in a Knowledge-assisted Visual Analytics Prototype for Malware Analysis. Proceedings of the 10th Forum Media Technology 2017, 116–123. http://mc.fhstp.ac.at/sites/default/files/publications/Schick_RuleCreation_2017.pdf
Thür, N., Wagner, M., Schick, J., Niederer, C., Eckel, J., Luh, R., & Aigner, W. (2017). BiG2-KAMAS: Supporting Knowledge-Assisted Malware Analysis with Bi-Gram Based Valuation. Poster of the 14th Workshop on Visualization for Cyber Security (VizSec). http://mc.fhstp.ac.at/sites/default/files/publications/vizsec-poster-2017%20%281%29.pdf
Schick, J., Wagner, M., Thür, N., Niederer, C., Rottermanner, G., Tavolato, P., & Aigner, W. (2017). Supporting Knowledge-assisted Rule Creation in a Behavior-based Malware Analysis Prototype. Poster of the 14th Workshop on Visualization for Cyber Security (VizSec). http://mc.fhstp.ac.at/sites/default/files/publications/vizsec-poster-2017.pdf
Blumenstein, K., Niederer, C., Wagner, M., Pfersmann, W., Seidl, M., & Aigner, W. (2017). Visualizing Spatial and Time-Oriented Data in a Second Screen Application. Proceedings of the 19th International Conference on Human-Computer Interaction with Mobile Devices and Services.
Wagner, M. (2017). Integrating Explicit Knowledge in the Visual Analytics Process [PhD Thesis, Vienna University of Technology]. http://mc.fhstp.ac.at/sites/default/files/publications/20170623_Dissertation_Markus_WAGNER.pdf
Rind, A., Haberson, A., Blumenstein, K., Niederer, C., Wagner, M., & Aigner, W. (2017). PubViz: Lightweight Visual Presentation of Publication Data. In B. Kozlíková, T. Schreck, & T. Wischgoll (Eds.), Proc. Eurographics Conf. Visualization (EuroVis) – Short Paper (pp. 169–173). EuroGraphics. https://doi.org/10/cwdc
Aigner, W. (2017, April 5). Mit Visual Analytics zu Data-Driven Banking [Keynote]. Bankensymposium Wachau, Göttweig (Austria).
Tominski, C., Aigner, W., Miksch, S., & Schumann, H. (2017). Images of Time: Visual Representation of Time-Oriented Data. In A. Black, P. Luna, O. Lund, & S. Walker (Eds.), Information Design: Research and Practice (pp. 23–42). Gower/Routledge. http://mc.fhstp.ac.at/sites/default/files/publications/Tominski17ImagesOfTime.pdf
Bernard, Jürgen, Zeppelzauer, Matthias, Sedlmair, Michael, & Hutter, M. (2017). A Unified Process for Visual-Interactive Labeling. In Proceedings of the 8th International EuroVis Workshop on Visual Analytics.
Wagner, M., Rind, A., Thür, N., & Aigner, W. (2017). A knowledge-assisted visual malware analysis system: design, validation, and reflection of KAMAS. Computers & Security, 67, 1–15. https://doi.org/10/b5j9
Bögl, M., Filzmoser, P., Gschwandtner, T., Lammarsch, T., Leite, R. A., Miksch, S., & Rind, A. (2017). Cycle Plot Revisited: Multivariate Outlier Detection Using a Distance-Based Abstraction. Computer Graphics Forum, 36, 227–238. https://doi.org/10/gbnsx6
Wagner, M., Sacha, D., Rind, A., Fischer, F., Luh, R., Schrittwieser, S., Keim, D. A., & Aigner, W. (2017). Visual Analytics: Foundations and Experiences in Malware Analysis. In L. B. Othmane, M. G. Jaatun, & E. Weippl (Eds.), Empirical Research for Software Security: Foundations and Experience (pp. 139–171). CRC/Taylor and Francis.
Federico, P., Wagner, M., Rind, A., Amor-Amorós, A., Miksch, S., & Aigner, W. (2017). The Role of Explicit Knowledge: A Conceptual Model of Knowledge-Assisted Visual Analytics. IEEE Conference on Visual Analytics Science and Technology (VAST), 92–103. https://doi.org/10/ghppzr
Bernád, Á. Z., Kaiser, M., Mair, S. M., & Rind, A. (2017). Communities in biographischen Netzwerken. Proceedings of the 10th Forum Media Technology and 3rd All Around Audio Symposium, 83–87. http://ceur-ws.org/Vol-2009/fmt-proceedings-2017-paper12.pdf
Luh, R., Schramm, G., Wagner, M., & Schrittwieser, S. (2017). Sequitur-based Inference and Analysis Framework for Malicious System Behavior. First International Workshop on Formal Methods for Security Engineering. https://doi.org/10/cwdb
Kromer, L., Wagner, M., Blumenstein, K., Rind, A., & Aigner, W. (2016). Performance Comparison between Unity and D3.js for Cross-Platform Visualization on Mobile Devices. Proceedings of the 9th Forum Media Technology 2016, 47–52. http://mc.fhstp.ac.at/sites/default/files/publications/Kromer_2016_FMT_crossVisComparison.pdf
Aigner, W. (2016, October 31). Visual Analytics of Time-Oriented Data and its Complex Structures [Invited talk].
Aigner, W. (2016, May 7). Research Highlights at the Institute of Creative\Media/Technologies [Invited Talk]. Chair of Computer Graphics, University of Rostock, Germany.
Aigner, W., & Blumenstein, K. (2016, March 5). Data Visualisation in Time-Based Media [Workshop]. c-tv Konferenz, St. Pölten, Austria. https://ctvkonferenz.fhstp.ac.at/
Blumenstein, K., Niederer, C., Wagner, M., Schmiedl, G., Rind, A., & Aigner, W. (2016). Evaluating Information Visualization on Mobile Devices: Gaps and Challenges in the Empirical Evaluation Design Space. Proceedings of 2016 Workshop on Beyond Time And Errors: Novel Evaluation Methods For Visualization, 125–132. https://doi.org/10/cwc6
Wagner, M., Rind, A., Rottermanner, G., Niederer, C., & Aigner, W. (2016). Knowledge-Assisted Rule Building for Malware Analysis. Proceedings of the 10th Forschungsforum Der Oesterreichischen Fachhochschulen.
Bögl, M., Aigner, W., Filzmoser, P., Gschwandtner, T., Lammarsch, T., Miksch, S., & Rind, A. (2016). Visual Analytics for Time Series Model Selection, Prediction, and Imputation. Extended Abstract at Austrian Statistical Days. https://publik.tuwien.ac.at/files/PubDat_242014.pdf
Ceneda, D., Aigner, W., Bögl, M., Gschwandtner, T., & Miksch, S. (2016). Guiding the Visualization of Time-Oriented Data. Poster Abstracts of IEEE Conference on Visual Analytics Science and Technology (VAST 2016).
Wagner, M., Blumenstein, K., Rind, A., Seidl, M., Schmiedl, G., Lammarsch, T., & Aigner, W. (2016). Native Cross-platform Visualization: A Proof of Concept Based on the Unity3D Game Engine. Proceedings of International Conference on Information Visualisation (IV16), forthcoming. https://doi.org/10/cwc7
Rind, A., Aigner, W., Wagner, M., Miksch, S., & Lammarsch, T. (2016). Task Cube: A Three-Dimensional Conceptual Space of User Tasks in Visualization Design and Evaluation. Information Visualization, 15(4), 288–300. https://doi.org/10/f3szvq
Blumenstein, K., Wagner, M., & Aigner, W. (2015, November 15). Cross-Platform InfoVis Frameworks for Multiple Users, Screens and Devices: Requirements and Challenges. DEXiS 2015 Workshop on Data Exploration for Interactive Surfaces. Workshop in Conjunction Wirth ACM ITS"15.
Rind, A. (2015, October 21). Visual Analytics of Health Care Data with a Focus on Time [Invited talk]. International Workshop 2015: Medical records update, Pesaro, Italy.
Blumenstein, K., Wagner, M., Aigner, W., von Suess, R., Prochaska, H., Püringer, J., Zeppelzauer, M., & Sedlmair, M. (2015). Interactive Data Visualization for Second Screen Applications: State of the Art and Technical Challenges. In H.-J. Schulz, B. Urban, & U. Freiherr von Lukas (Eds.), Proceedings of the International Summer School on Visual Computing (pp. 35–48). Frauenhoferverlag. https://research.fhstp.ac.at/content/download/128715/file/Blumenstein_et_al_2015_Interactive_Data_Visualization_for_Second_Screen.pdf?inLanguage=ger-DE
Wagner, M., Aigner, W., Haberson, A., & Rind, A. (2015, April). Literature review in visual analytics for malware pattern analysis. Proceedings of the 9th Forschungsforum Der Österreichischen Fachhochschulen.
Wagner, M. (2015, March). Integrating Explicit Knowledge in the Visual Analytics Process. Doctoral Consortium on Computer Vision, Imaging and Computer Graphics Theory and Applications (DCVISIGRAPP 2015).
Rind, A. (2015, January 21). Visual Analytics with a Focus on Time [Invited talk]. MAP 2015, CNRS, Marseille, France.
Aigner, W., Miksch, S., Schumann, H., & Tominski, C. (2015). Visualization Techniques for Time-Oriented Data. In M. O. Ward, G. Grinstein, & D. Keim (Eds.), Interactive Data Visualization: Foundations, Techniques, and Applications (2nd ed., pp. 253–284). A K Peters/CRC Press. https://www.crcpress.com/product/isbn/9781482257373
Wagner, M., Fischer, F., Luh, R., Haberson, A., Rind, A., Keim, D. A., & Aigner, W. (2015). A Survey of Visualization Systems for Malware Analysis. In R. Borgo, F. Ganovelli, & I. Viola (Eds.), Eurographics Conference on Visualization (EuroVis) - STARs (pp. 105–125). The Eurographics Association. https://doi.org/10/cwc4
Bögl, M., Aigner, W., Filzmoser, P., Gschwandtner, T., Lammarsch, T., Miksch, S., & Rind, A. (2015). Integrating Predictions in Time Series Model Selection. In E. Bertini & J. C. Roberts (Eds.), Proceedings of theEuroVis Workshop on Visual Analytic, EuroVA (pp. 73–77). Eurographics. https://doi.org/10/f3szvn
Blumenstein, K. (2015). Interactive Mobile Data Visualization for Second Screen. Doctoral Consortium on Computer Vision, Imaging and Computer Graphics Theory and Applications (DCVISIGRAPP 2015).
Stitz, H., Gratzl, S., Aigner, W., & Streit, M. (2015). ThermalPlot: Visualizing Multi-Attribute Time-Series Data Using a Thermal Metaphor. IEEE Transactions on Visualization and Computer Graphics, 22, 2594–2607. https://doi.org/10/ghppzs
Stitz, H., Gratzl, S., Aigner, W., & Streit, M. (2015). ThermalPlot: Visualizing Multi-Attribute Time-Series Data Using a Thermal Metaphor. Poster Abstracts of IEEE Conference on Information Visualization (InfoVis "15). http://mc.fhstp.ac.at/sites/default/files/publications/Stitz%20et%20al_2015_ThermalPlot.pdf
Bögl, M., Filzmoser, P., Gschwandtner, T., Miksch, S., Aigner, W., Rind, A., & Lammarsch, T. (2015). Visually and Statistically Guided Imputation of Missing Values in Univariate Seasonal Time Series. Poster Proceedings of the IEEE Visualization Conference 2015. https://doi.org/10/gh3744
Alsallakh, B., Micallef, L., Aigner, W., Hauser, H., Miksch, S., & Rodgers, P. (2015). The State-of-the-Art of Set Visualization. Computer Graphics Forum, Early view. https://doi.org/10/cwc5
Wagner, M., Aigner, W., Rind, A., Dornhackl, H., Kadletz, K., Luh, R., & Tavolato, P. (2014). Problem Characterization and Abstraction for Visual Analytics in Behavior-Based Malware Pattern Analysis. In L. Harrison (Ed.), Proceedings of the Eleventh Workshop on Visualization for Cyber Security (pp. 9–16). ACM. https://doi.org/10/cv8p
Alsallakh, B., Micallef, L., Aigner, W., Hauser, H., Miksch, S., & Rodgers, P. (2014). Visualizing Sets and Set-typed Data: State-of-the-Art and Future Challenges (R. Borgo, R. Maciejewski, & I. Viola, Eds.). Eurographics. http://publik.tuwien.ac.at/files/PubDat_228538.pdf
Gschwandtner, T., Aigner, W., Miksch, S., Gärtner, J., Kriglstein, S., Pohl, M., & Suchy, N. (2014). TimeCleanser: A Visual Analytics Approach for Data Cleansing of Time-Oriented Data. In S. Lindstaedt, M. Granitzer, & H. Sack (Eds.), 14th International Conference on Knowledge Technologies and Data-driven Business (i-KNOW 2014) (Graz, Austria; pp. 1–8). ACM Press. https://doi.org/10/ghtw5j
Lammarsch, T., Aigner, W., Bertone, A., Miksch, S., & Rind, A. (2014). Mind the Time: Unleashing Temporal Aspects in Pattern Discovery. Computers & Graphics, 38, 38–50. https://doi.org/10/f3szvj
Rind, A., Aigner, W., Wagner, M., Miksch, S., & Lammarsch, T. (2014). User Tasks for Evaluation: Untangling the Terminology Throughout Visualization Design and Development. In H. Lam, P. Isenberg, T. Isenberg, & M. Sedlmair (Eds.), Proceedings of the Fifth Workshop on Beyond Time and Errors: Novel Evaluation Methods for Visualization (pp. 9–15). ACM. https://doi.org/10/f3szvm
Miksch, S., & Aigner, W. (2014). A Matter of Time: Applying a Data-Users-Tasks Design Triangle to Visual Analytics of Time-Oriented Data. Computers & Graphics, 38, 286–290. https://doi.org/10/f3szvk
Bögl, M., Aigner, W., Filzmoser, P., Gschwandtner, T., Lammarsch, T., Miksch, S., & Rind, A. (2014). Visual Analytics Methods to Guide Diagnostics for Time Series Model Predictions. In A. Perer, E. Bertini, R. Maciejewski, & J. Sun (Eds.), Proceedings of the IEEE VIS 2014 Workshop Visualization for Predictive Analytics, VPA. https://publik.tuwien.ac.at/files/PubDat_232994.pdf
Lammarsch, T., Aigner, W., Miksch, S., & Rind, A. (2014). Showing Important Facts to a Critical Audience by Means Beyond Desktop Computing. Proceedings of the IEEE VIS 2014 Workshop on Envisioning Visualization without Desktop Computing. https://publik.tuwien.ac.at/files/PubDat_233657.pdf

Press coverage

Ordnung und Wissen in die Datenflut bringen
04/08/2019

Eine Forschungsgruppe von der Fachhochschule St. Pölten hat im Rahmen eines vom Wissenschaftsfonds FWF finanzierten Projekts eine vielseitig einsetzbare Umgebung zur Datenvisualisierung entwickelt, in der auf einfache Weise Expertenwissen integriert werden kann.

Medium: scilog

Vorbereiten auf die digitale Welt
11/16/2016

Medium: Der Standard

Wissenschaft und Forschung in Niederösterreich
11/01/2016

Medium: UNIVERSUM Magazin

Big Data – und welche Chancen Daten bieten
06/10/2016

Medium: Die Presse

"Landkarte und Kompass für den Datendschungel"
11/30/2016

Medium: Der Standard
Autor: Alois Pumhösel

Teamwork zwischen Gehirn und Prozessor
06/02/2014

Medium: Der Standard
Author: Pumhösel Alois

Visual-Analytics-Systeme sollen ihren Benutzern durch eine anschauliche Aufbereitung mehr Übersicht über Datenmaterial geben. Niederösterreichische Forscher entwickeln eine Plattform, in der automatische und menschliche Analyse Hand in Hand gehen.

Partners
  • Fachbereich Informatik und Informationswissenschaft, Universität Konstanz
  • information engineering group, TU Vienna
  • Datenanalyse und Visualisierung, Universität Konstanz
  • Institut für Informatik, Universität Rostock
Funding
FWF – Fonds zur Förderung der wissenschaftlichen Forschung
Runtime
01/01/2013 – 07/31/2018
Status
finished
Involved Institutes, Groups and Centers
Center for Digital Health and Social Innovation
Institute of Creative\Media/Technologies
Research Group Media Computing